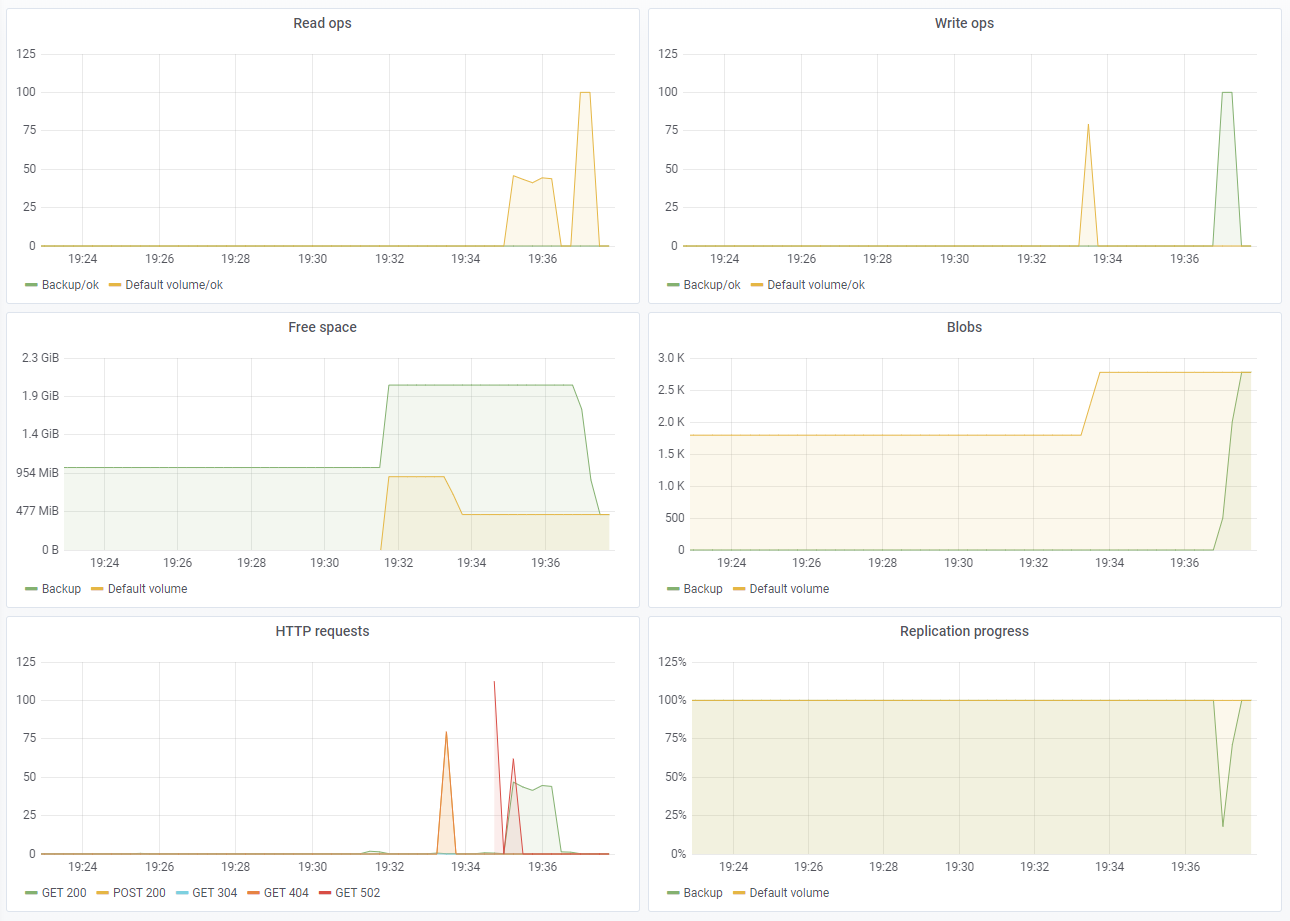
Observability (Prometheus metrics)
Observe how Varasto is doing from key metrics like:
- Per-volume:
- Used and free space
- Blob count
- Read/write requests, errors and byte counts
- Replication progress
- HTTP server request counts partitioned over status code and method
- Scheduled job durations
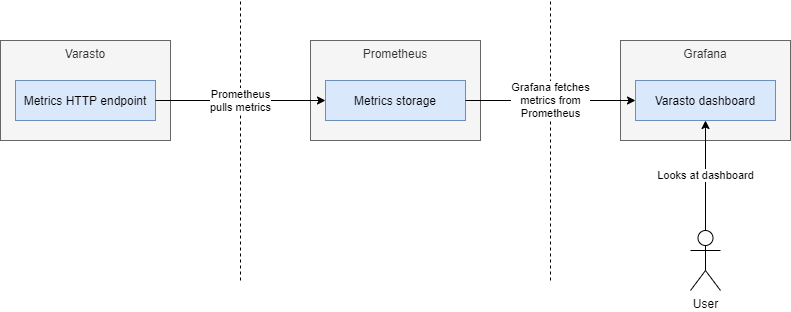
Prometheus
Varasto has Prometheus-compatible metrics. Prometheus does not offer built-in dashboards, but there are many dashboarding solutions that can read data off of Prometheus.
Grafana
Grafana is our recommendation for building dashboards from metrics in Prometheus (the example screenshot is from Grafana).
Here's how the whole looks:
Embed Grafana in Varasto
We also support embedding Grafana dashboard in Varasto's admin panel for quick access:
Tip
You need to enable allow_embedding in Grafana's config.